Quick Alert: Bitcoin: Buy the Dip??? Not so fast...!!!
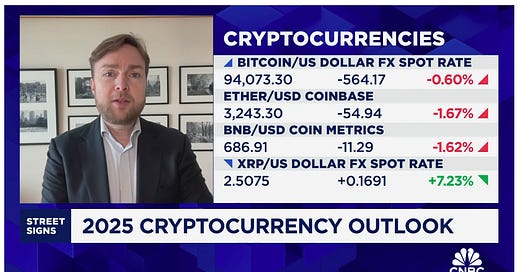
👇1-9) Bitcoin is currently retesting a critical support level. Please watch our interview with CNBC (here) below.
👇2-9) We have maintained a cautious outlook, anticipating a period of consolidation, particularly following the December shooting star pattern, which signaled a significant negative technical shift.
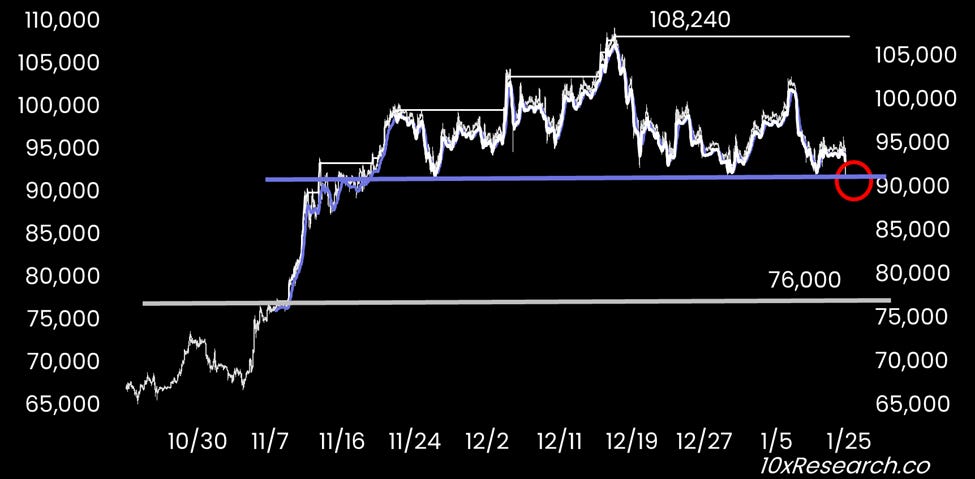
Bitcoin is testing the $91,000 level - hourly chart support.
👇3-9) With the $91,000 support level being retested, we believe it’s likely that Bitcoin will face further selling pressure, at least until the release of the CPI data. Additionally, as the negative inflation narrative overshadows Trump’s inauguration, we expect Bitcoin to consolidate further.
👇4-9) From a technical perspective, if the $91,000 support level is breached, the next significant support zones lie at $76,000 and potentially $69,000. Unfortunately, we expect the persistent high-inflation narrative to continue, likely driving bond yields higher and posing a headwind for Bitcoin and equities alike.
👇5-9) The 21-week moving average remains a crucial indicator of whether Bitcoin is in a bull market (above the average) or a bear market (below the average). Currently, this moving average stands at $84,800, which is close to the average entry price of short-term holders ($88,000 for positions established over the last 155 days). This proximity suggests the potential for liquidations around these levels.
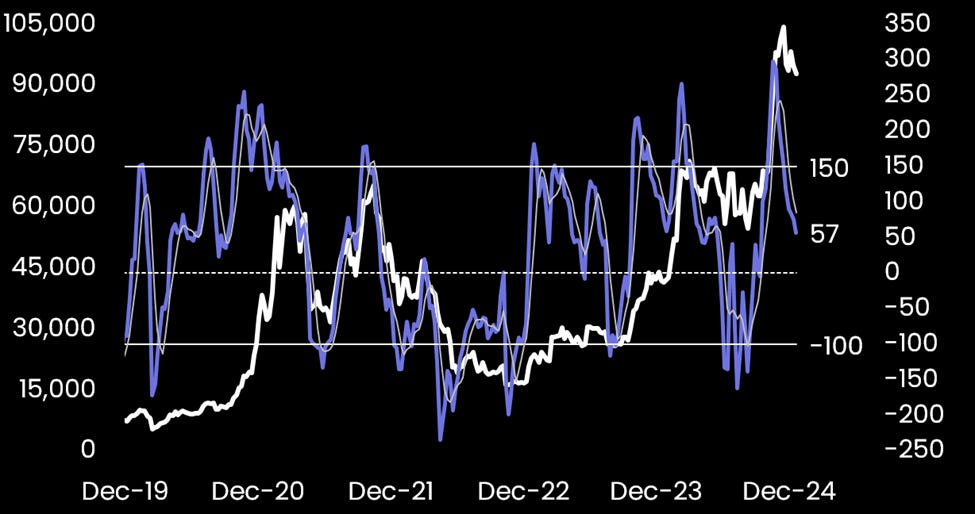
Bitcoin weekly CCI indicator - sub-100 seen as a good entry level
👇6-9) An analysis of various weekly technical indicators suggests they have not corrected to levels typically associated with more favorable risk-reward entry points. For instance, the Commodity Channel Index (CCI) remains significantly above -100—a level historically linked to better entry opportunities for multi-week investment horizons.
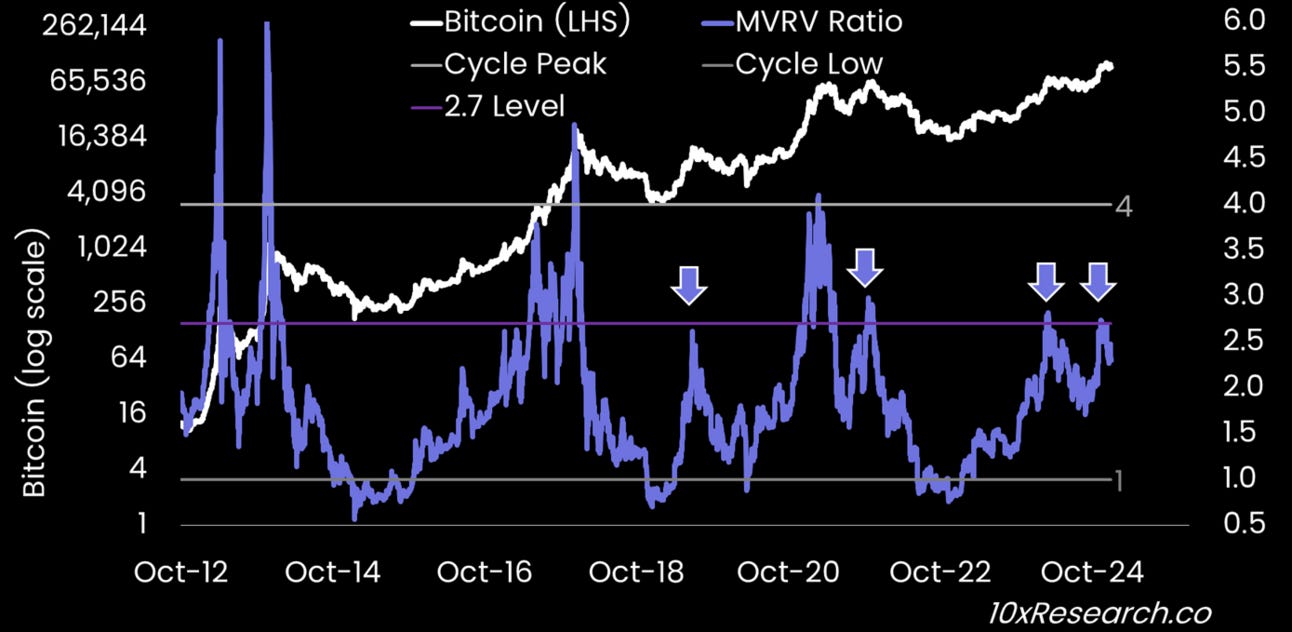
Bitcoin (log chart) vs. MVRV Ratio - 2.7x often marks a temporary top
👇7-9) On-chain data is approaching levels historically associated with profit-taking by smart money. The Market Value to Realized Value (MVRV) ratio has reached 2.7x, often triggering profit-taking. While the MVRV ratio has occasionally risen to 4x or even 6x, it signaled the onset of a major consolidation or correction in three out of the last four instances where it reached 2.7x.
👇8-9) We could reference other on-chain metrics, such as the Net Unrealized Profit/Loss (NUPL) ratio or similar indicators. Still, they all paint a consistent picture: Bitcoin has reached a level historically associated with smart money, reducing exposure. Additionally, the global money supply peaked in mid-December, suggesting the likelihood of an extended consolidation period for Bitcoin.
👇9-9) Coupled with our macro outlook—anticipating the Federal Reserve's hawkish stance to persist for several more months—and the observation that technical indicators have yet to reach levels signaling favorable risk-reward for long positions, we see a strong probability of Bitcoin testing downside targets at $76,000 and potentially $69,000.


