


Part 2: Is the Bitcoin Bull Market Over?
Several risk are emerging but will this stop the bull market?

👇1-10) Over the past two weeks, we have adopted a more cautious stance, raising the question: "Is the Bitcoin Bull Market Over?" Below, we outline key technical factors to consider.
👇2-10) In the early stages of Bitcoin bull markets, prices often close near their monthly highs, reflecting strong momentum. However, as the bull market matures or approaches its end, a different pattern emerges: prices tend to rally early in the month, only to sell off toward month-end as traders take profits.
Bitcoin during the 2017 and 2019 bull markets
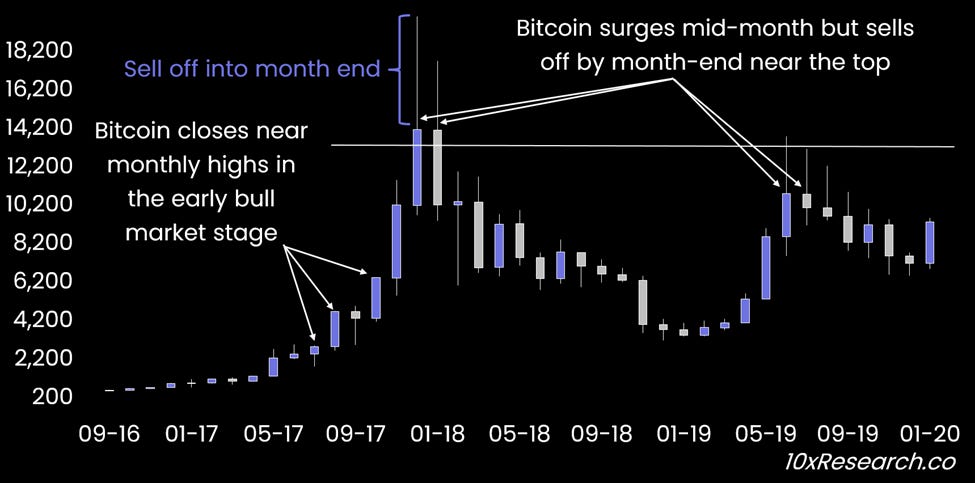
👇3-10) The 2017 bull market, for instance, featured increasingly large monthly candles, with prices often closing near their highs by month-end, reflecting strong bullish momentum. However, as the bull market approached its peak, profit-taking began to emerge, resulting in monthly closing prices significantly lower than the intra-month highs. While prices still closed higher for the month, the strong profit-taking was evident, particularly in December 2017, where the closing price was far below the month's peak.
👇4-10) From a technical analysis perspective, this behavior is often associated with the "shooting star" candlestick pattern. This pattern features a long upper wick and a small real body near the bottom of the candlestick, with the real body typically being less than half the size of the entire candle. It serves as a bearish reversal signal, indicating weakening buying pressure and potential price reversals.
Bitcoin during the 2017 and 2019 bull markets - Shooting Star
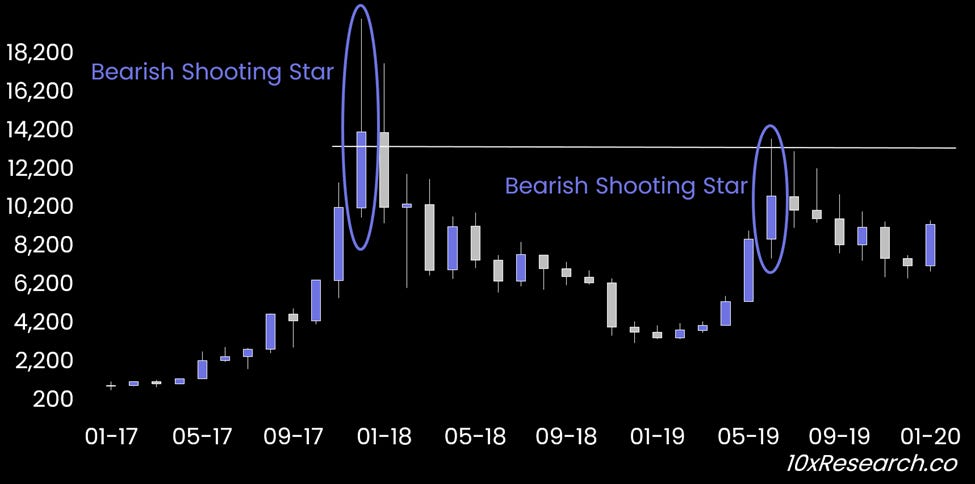
👇5-10) Or in other words, a shooting star is a bearish reversal candlestick pattern that typically forms after an uptrend. It features: a) A small real body near the bottom of the candlestick. b) A long upper shadow that is at least twice the size of the real body. c) Little to no lower shadow.
👇6-10) The pattern suggests that buyers initially drove the price higher during the trading period, but sellers regained control and pushed the price back down near its opening level. This results in a candlestick that resembles a "shooting star." The shooting star is generally seen as a warning sign that an uptrend may be losing momentum and a reversal could be imminent. Buyers are struggling to push the price higher.
👇7-10) The appearance of a shooting star pattern within a raging bull market is therefore of concern as the pattern pre-signalled the end of the 2017 bull market and also occurred in 2019 during an intermediate bull market, only to then see Bitcoin decline significantly.
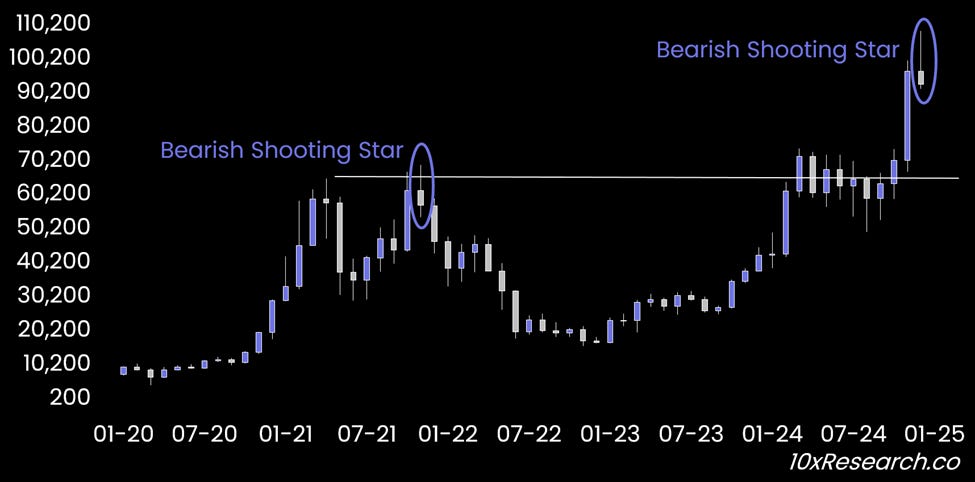
👇8-10) A similar pattern appeared in November 2021, marking the end of the last bull market. For the first time in this cycle, December 2024 has made history with a shooting star pattern. Prices rallied from $96,000 to a new all-time high of $108,000, only to close at $92,000. While there may be an early-month rally in January 2025, possibly leading into Trump’s inauguration, another wave of profit-taking by month-end could confirm that the December 2024 shooting star signaled at least an intermediate top.
Bitcoin during the 2021 and 2024 bull markets - Shooting Star
👇9-10) Bitcoin is likely to experience wild rallies and sell-offs in 2025, and paying close attention to technical signals could be crucial for staying ahead in such volatile conditions.
👇10-10) While we don’t believe this bull market is over, it appears we may be entering a more challenging trading range where effective risk management is crucial. As noted previously, the $90,000–$92,000 support range is critical; if it fails, a significant setback could follow.
Wishing you all the best for a successful 2025!