

Our Bitcoin/Crypto Game Plan for January - This Indicator Signals a BTC Rebound
Bitcoin balances on exchanges have dropped by 200,000...

If you no longer wish to receive our email reports, please click the unsubscribe link below.
👇1-12) The crypto trading environment remains mixed following the December FOMC meeting and the subsequent holiday season. However, opportunities for returns persist in specific areas. For instance, our recommendation on DeepBook (see report from December 17) has delivered an impressive +56% gain in a short period, even as Bitcoin consolidates. Rather than a continuous rally, Bitcoin appears to be navigating a tactical trading range, presenting opportunities for strategic positioning rather than a straightforward bullish trend.
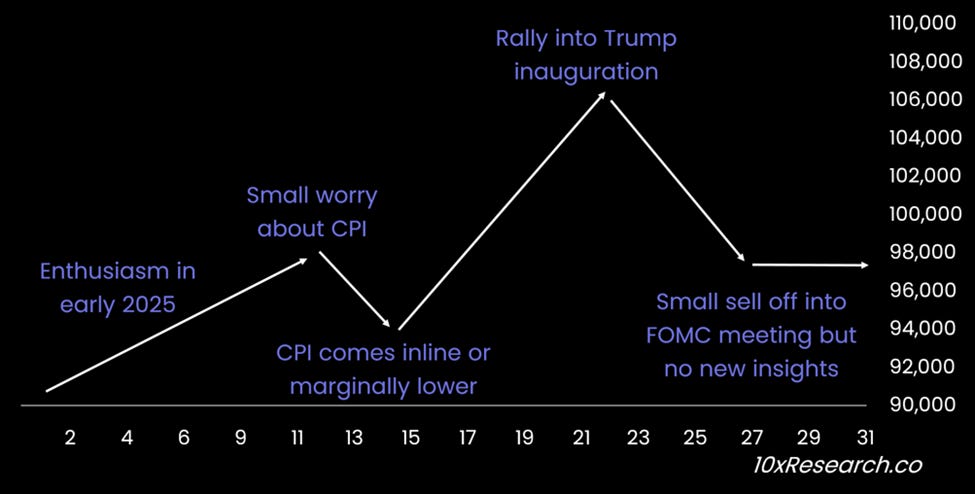
👇2-12) While some initial enthusiasm is expected at the start of the New Year, this is not the time for the same level of bullishness we experienced from late January to March 2024 or late September to mid-December. We anticipate a positive start to the year, followed by a slight pullback leading into the CPI data release on January 15. A favorable inflation print could reignite optimism, fueling a rally into the Trump inauguration on January 20. However, this momentum may wane, with the market likely retreating somewhat ahead of the FOMC meeting on January 29.
Projected Bitcoin path for January 2025 - key dates/events
👇3-12) From January 2024 to mid-November, Bitcoin dominance surged from 50% to 60%, creating significant headwinds for altcoin performance. Although the dominance indicator briefly plummeted to 53% within three weeks—fueling hopes for an altcoin season—it quickly rebounded to nearly 58% before consolidating around 55%. This consolidation highlights Bitcoin's enduring dominance as the primary driver of the crypto market while also signaling potential challenges for altcoins—unless the Bitcoin dominance indicator experiences another decline.
👇4-12) Spot trading volumes have significantly declined, returning to levels before the U.S. election. Binance's spot volume has dropped to $12 billion, down sharply from its peak of $65 billion. Similarly, in Korea's retail-driven altcoin market—often referred to as "altcoin nirvana"—volumes have fallen back to $8 billion from a high of $25 billion - although volumes in Korea are materially higher than before the election.
👇5-12) While some smaller market segments have outperformed briefly—often for just a few days or weeks—traders must act swiftly to capitalize on these fleeting opportunities. Our money flow indicators reveal the market has entered a quieter consolidation phase after strong inflows in Q1 and Q4 of 2024. This environment is characterized by less aggressive upward momentum for Bitcoin and altcoins.
Bitcoin (LHS) vs. Money Flow indicators (RHS, $ billions) - $129bn of inflows
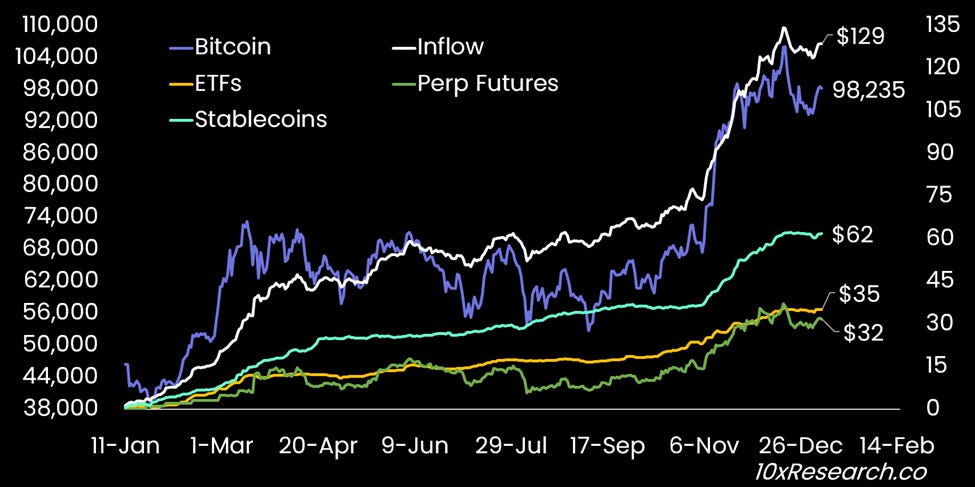
👇6-12) Over the past year, we’ve observed $129 billion in total inflows, with $62 billion from stablecoins, $35 billion from Bitcoin ETFs, and $32 billion from increased perpetual futures leverage. As traders return from the holiday season, monitoring the evolution of these inflows will be critical. Notably, Thursday, January 9, will be a U.S. stock market holiday in honor of former President Jimmy Carter, potentially influencing market activity with fewer inflows.
👇7-12) Bitcoin balances on crypto exchanges continue to decline sharply, with only three platforms holding more than 150,000 Bitcoins. Coinbase leads with 717,000 Bitcoins, despite a 30-day outflow of 48,000. Binance follows with 572,000 and an outflow of 6,500, and Bitfinex follows with 361,000, which saw outflows of 27,000.
👇8-12) Since the Trump election, total Bitcoin balances on exchanges have dropped by 200,000, leaving just 2.7 million Bitcoins on these platforms. Such significant withdrawals often signal that holders do not intend to sell, typically regarded as a bullish indicator. This trend also raises the argument that exchanges gradually run out of Bitcoin. At the same time, over-the-counter (OTC) desk holdings remain at historically low levels, further tightening supply - which is bullish.
👇9-12) Bitcoin's performance at the end of January will be a critical indicator. Following the hawkish December FOMC meeting, Bitcoin ETF inflows have notably slowed, compounded by less favorable global liquidity conditions. This has led to a period of consolidation, aligning with expectations over the holidays. Our primary focus is on technical levels, as informed by the December "shooting star" candlestick pattern. A January close below December's closing price would suggest a potential topping formation, signaling caution.
👇10-12) While the rebound of the ISM Manufacturing Index is a positive development for Bitcoin, it may be short-lived. The uptick could be driven by inventory rebuilding in anticipation of potential Trump tariffs rather than confidence in sustained economic growth.
Bitcoin is attempting another break above $100,000
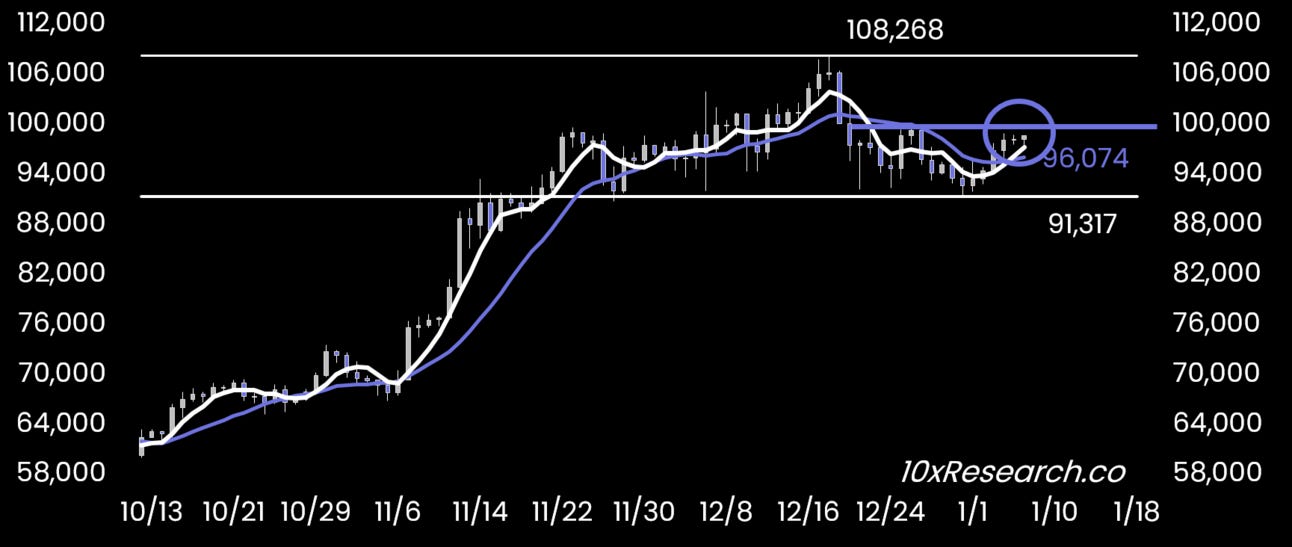
👇11-12) We believe Bitcoin is poised for another attempt to break the $100,000 mark. As noted earlier, a rebound is likely in early January, driven by optimism ahead of the January 20 Trump inauguration. However, the primary risk remains the Federal Reserve's communication, especially if renewed concerns about inflation emerge. We anticipate lower inflation this year, though it may take some time for the Federal Reserve to recognize and respond to this shift formally.
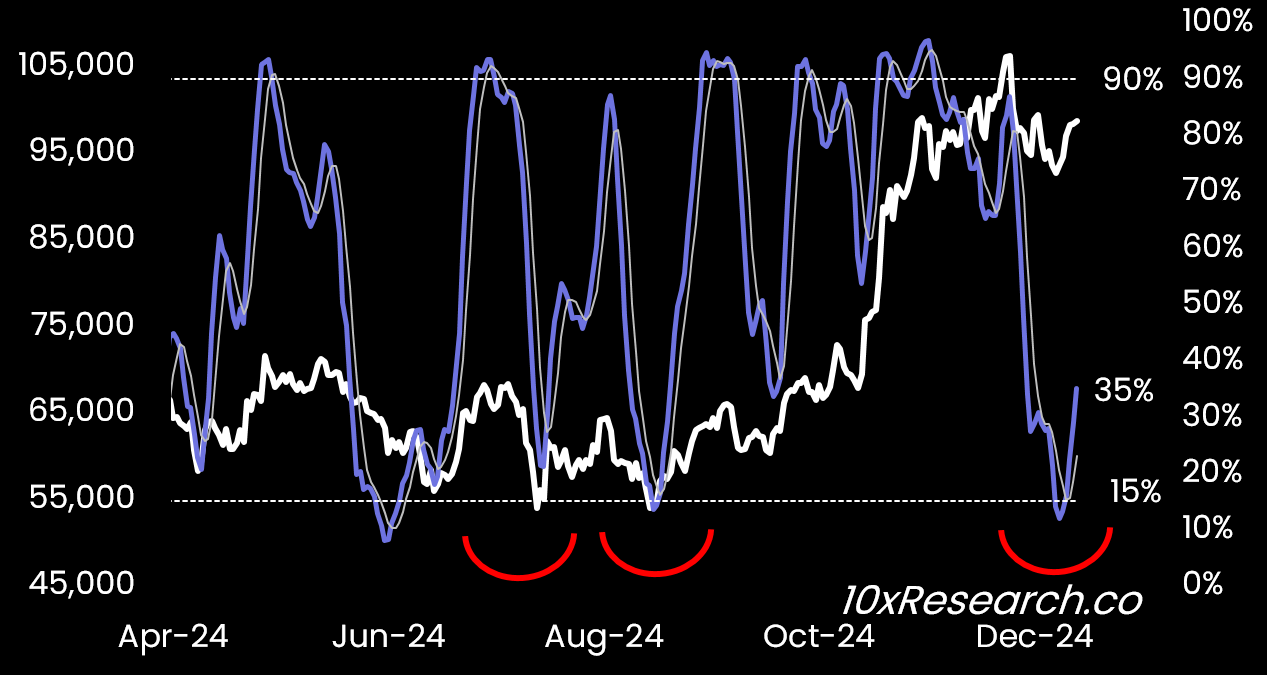
👇12-12) A key factor is whether institutional investors will re-enter the crypto market, reflected in increased stablecoin minting and renewed buying activity from U.S. Bitcoin ETF investors. These inflow indicators have been skewed over the past three weeks, likely due to the holiday season. As traders and investors return, these dynamics could shift significantly. Bitcoin's (daily) stochastic indicator has sufficiently retraced to levels that suggest a rebound is likely.
Bitcoin (LHS) vs. BTC Stochastics Indicator (RHS)