


MicroStrategy Shares Plunge 44%—And That’s Not Bitcoin’s Only Challenge for 2025
Will January see increased profit-taking for Bitcoin?

👇1-15) On October 7, we highlighted MicroStrategy’s breakout as its share price climbed above $177. However, in recent weeks, we have stressed the company’s overvaluation. Rather than serving as a true leveraged play on Bitcoin, investors have been significantly overpaying for indirect Bitcoin exposure.
Bitcoin (LHS) vs. MicroStrategy (RHS)
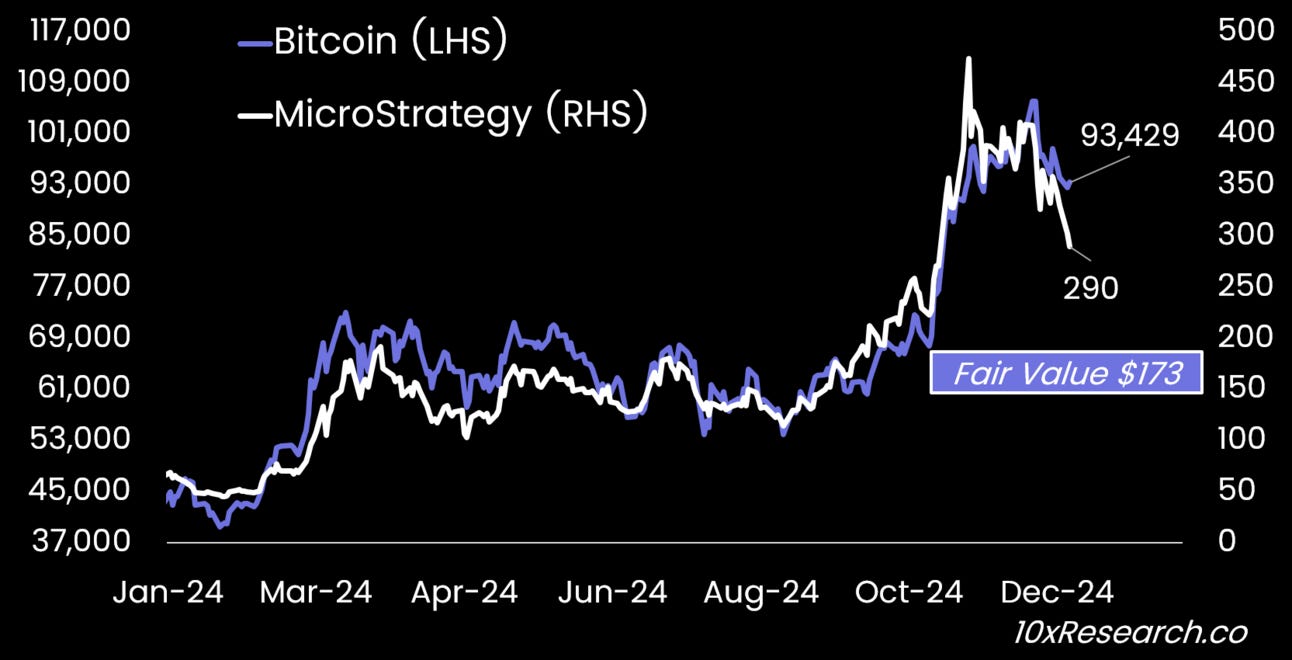
👇2-15) The stock’s underperformance, despite substantial Bitcoin acquisitions, indicates that investors are no longer willing to pay an implied price of $200,000 (or more) per Bitcoin through MicroStrategy when it can be purchased directly at a much lower cost. This suggests that stock investors are no longer willing to prop up MicroStrategy with an inflated NAV. The shift underscores a growing rationality among investors who previously bought into the unofficial narrative of MicroStrategy as "a leveraged Bitcoin play."
👇3-15) There’s no denying that BlackRock’s Larry Fink and MicroStrategy’s Michael Saylor have been pivotal figures in shaping the narrative of this bull market, driving significant interest in Bitcoin. While some investors may not be positioned to buy Bitcoin ETFs directly, many have turned to MicroStrategy as an alternative.
👇4-15) However, with MicroStrategy shares now down 44% from their peak and other companies adopting Bitcoin as a treasury asset strategy at a much smaller scale, the Bitcoin tailwind generated by this narrative appears to be losing steam. Combined with other factors - as we explain below, Bitcoin enters the New Year on a cautious note, with liquidity, trading volumes, and stablecoin issuance momentum playing critical roles in determining its direction.
👇5-15) A year ago, we noted that MicroStrategy shares were 20% overvalued and suggested the company would leverage this premium by issuing new shares to lock in the excess valuation. True to form, by February, the NAV premium disappeared and the shares declined, only to surge and peak at 240% above its NAV on November 20. With shares outstanding increasing from 145 million in December 2023 to 240 million a year later, MicroStrategy has capitalized on the Bitcoin rally like no other, fueled by the irrational exuberance of stock investors.
👇6-15) This dynamic, while benefiting Bitcoin’s price, has significantly diluted shareholders. It has since dropped back to a 70% premium (1.7x NAV) as the shares have declined -44% since the November 20 high. MicroStrategy holds 0.00181863 Bitcoin per share, translating to a fair value of $173 per share based on current Bitcoin prices (vs. the market price of $289).
👇7-15) When accounting for the $7.3 billion in convertible debt, the diluted value drops further to $150 per share (0.00158625 Bitcoin per share). With an average cost basis of $62,000 per Bitcoin, this underscores the company’s aggressive financial engineering strategy. Despite the shares' underperformance relative to Bitcoin, they remain significantly overvalued - but this is not the only Bitcoin headwind going into 2025.
Bitcoin (LHS) vs. 7-week Stablecoin Minting Momentum (RHS, $bn)

👇8-15) Stablecoin net inflows have turned negative over the past few days, a key data point to watch closely. This contrasts with the strong stablecoin inflows observed during the spike in trading volumes following the September FOMC meeting and Trump’s election in November. The recent decline may reflect the Fed’s hawkish December stance reversing some of these flows, or it could simply be the result of reduced activity during the Christmas holidays. Tracking stablecoin minting and liquidity trends will be critical in the first few working days of the New Year.
Google Search Trends for ‘Bitcoin’ - last 5 years
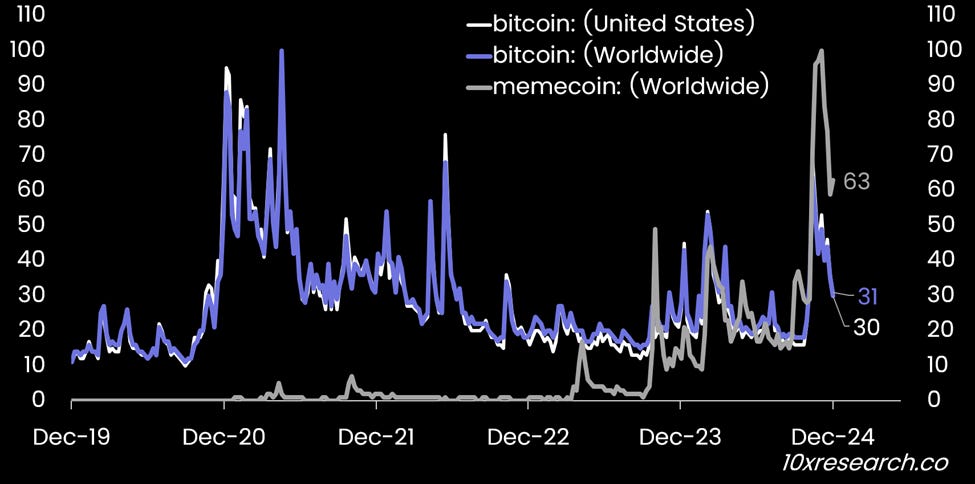
👇9-15) Although fewer people need to search for "Bitcoin" these days, its decline as a Google search trend indicates reduced activity and waning momentum, which could dampen buying interest. While this is typically a lagging indicator that may spike during sudden rallies, a rising Google search score often coincides with upward price movement when both are trending higher. Currently, however, that alignment is absent. Search interest in memecoins remains strong, despite a decline from their early December peak. Notably, December 2024 marked the highest level of memecoin search activity ever recorded.
👇10-15) The drop in funding rates for Bitcoin and other cryptocurrencies is closely tied to the decline in trading volumes. Retail trading volumes in Korea, often linked to altcoin performance, have fallen sharply from $25 billion to less than $4 billion - similar to the March/April decline.
👇11-15) Historically, rising funding rates and surging retail trading volumes have driven strong altcoin performance, while declines in both tend to expose the market to profit-taking. This dynamic has been evident over the past 2–4 weeks. For a sustainable rebound in January, we would need to see both funding rates and trading volumes increase.
Bitcoin (LHS) vs. Global Liquidity (RHS, $ trillions, 13 weeks ahead)
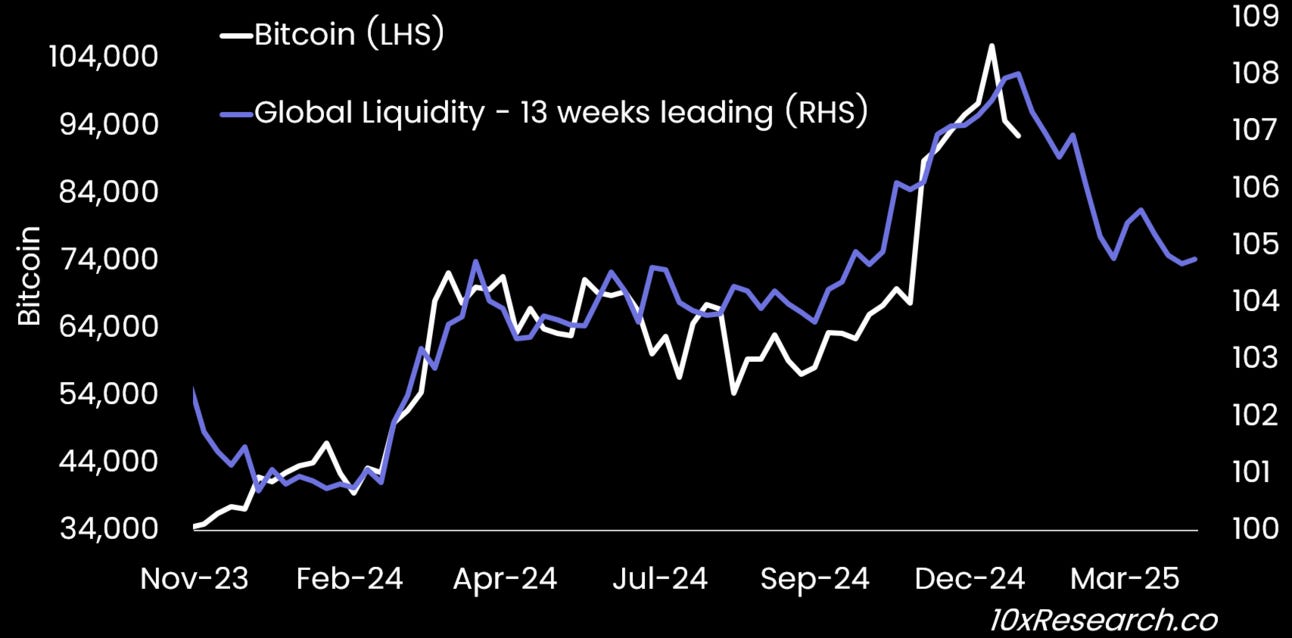
👇12-15) While the relationship between liquidity and Bitcoin is not perfect, there are notable overlaps, with liquidity trends typically leading Bitcoin by roughly 13 weeks. The recent contraction in global liquidity, based on data from nearly 30 central banks, may partly reflect the stronger US dollar. However, we also anticipate that liquidity could remain a headwind in the coming months.
👇13-15) The Federal Reserve is likely to maintain its hawkish stance for the next two quarters, and the US Treasury’s potential efforts to extend debt duration could further reduce net liquidity. This contraction could be seen as a "payback" for the ample liquidity provided ahead of the US election, seemingly designed to create a feel-good factor among voters.
👇14-15) As noted yesterday, the monthly shooting star formation is a significant indicator, highlighting how strong buy flows earlier in the month were abruptly overtaken by equally strong sell flows. This pattern often emerges at or near Bitcoin cycle or intermediate tops. The December closing price of $93,780 and the November closing price of $96,506 are key levels to watch. Additionally, the December low of $91,000–$92,000 serves as a critical zone to consider locking in profits from the parabolic rally that began after the September FOMC meeting.
👇15-15) We anticipate a rally attempt in early January, but the key question is whether this momentum will fizzle out or if we’ll see a sudden increase in trading volumes and a resurgence in stablecoin minting activity. Overall, the market structure appears fatigued, contributing to Bitcoin’s current consolidation phase. While many participants are still in holiday mode until next Monday, the following week could provide critical insights into Bitcoin’s next directional move.