Liquidity Charts Signal Bitcoin's Next Move ??? Key Technical Levels to Watch Now
On-chain data, retail activity and now liquidity...
👇1-13) On Monday, we highlighted on-chain data reaching levels historically associated with Bitcoin price peaks, alongside a noticeable slowdown in retail trading activity. On Tuesday, we identified Bitcoin's key technical support levels, which were tested overnight but have thus far held. However, given the current liquidity dynamics, traders should exercise caution and closely monitor whether Bitcoin can maintain these critical support levels.
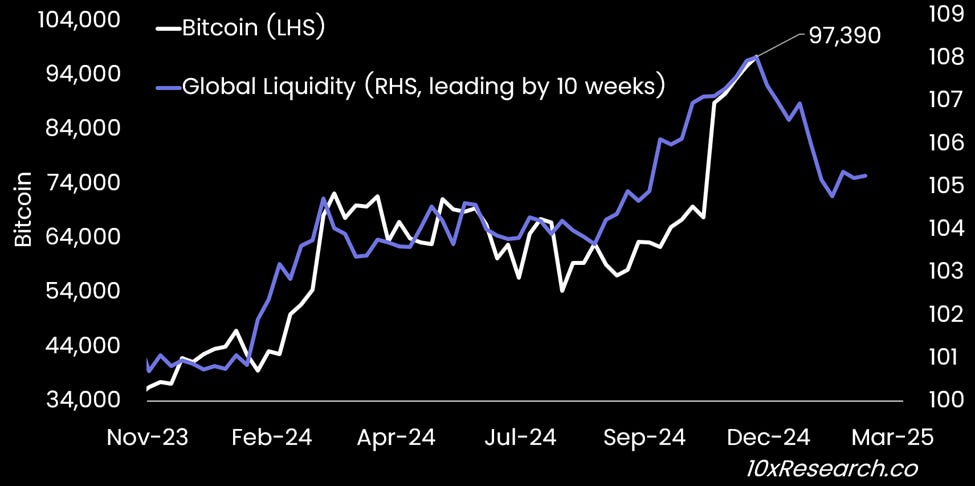
👇2-13) Over the past 12 months, an intriguing pattern has emerged in which global liquidity trends appear to lead Bitcoin's movements by approximately 10 weeks. This relationship seems to have successfully forecasted Bitcoin's rally in Q1, its six-month consolidation, and the subsequent rally in October and November, which was later followed by a decline in Global Liquidity driven by a stronger USD.
👇3-13) This forward-looking time series suggests that Bitcoin may be approaching a peak. While we cannot rule out this possibility, it’s important to recognize the limited long-term reliability of this relationship (for day to day predictions). However, in the short term, the correlation with Bitcoin's trajectory has been notable (Please read the explanation below before drawing any premature conclusions from this chart).
Bitcoin (LHS) vs. Global Liquidity (RHS, $ trillions, leading by 10 weeks)


