

Is Bitcoin Breaking Out? Yes, but Smart Traders Should do this...!
To navigate this environment, traders can structure positions strategically

If you no longer wish to receive our email reports, please click the unsubscribe link below (at the bottom).
👇1-15) Bitcoin closely aligns with our ‘January Game Plan’ price forecast, which anticipated an initial rally through January 10, followed by an inflation-driven dip and a strong rebound driven by better-than-expected inflation data, culminating in a sharp push leading into Trump’s inauguration. This scenario appears to be unfolding as expected, leaving the key question: What will Bitcoin do post-Rally into Trump Inauguration?
Still valid? Our projected Bitcoin path (white expected, purple actual)

👇2-15) Given the market’s tendency to shift quickly, our research outlines the key data series we track. This enables informed readers to adjust their positions as new economic data emerges or as pivotal news—such as Fed statements and commentary—potentially alters the market's trajectory. If the Fed maintains a hawkish stance and the market structure does not improve significantly, the bull market could temporarily pause until March. However, this week has seen notable signs of progress.
👇3-15) While we anticipated the inflation-driven sell-off to reverse following the release of the CPI data, Bitcoin rebounded a day earlier after the Producer Price Index (PPI) showed a better-than-expected increase of just +0.2%, compared to the forecasted +0.4%. Expectations for the CPI had risen significantly in the lead-up to its release, suggesting that even an inline reading would signal the expected turnaround. However, the recovery was further supported by a modest improvement in the CPI core reading, reinforcing the market's sentiment shift.
👇4-15) The typically hawkish Fed Governor Christopher Waller made an unexpected appearance on CNBC, where he struck a notably dovish tone. He acknowledged continued progress toward the Fed's 2.0% core inflation target and suggested that rate cuts could occur as early as the year's first half. While emphasizing that the probability remains low, he even entertained the possibility of a rate cut in March, with 3-4 cuts still on the table for 2025. This unexpectedly dovish commentary, combined with favorable inflation data, significantly accelerated the reversal in Bitcoin prices.
👇5-15) Between the December FOMC meeting and the January CPI report, Bitcoin ETFs offloaded $1.2 billion worth of Bitcoin. However, following the inline CPI print and stronger-than-expected core inflation data, these ETFs reversed course, purchasing $2.4 billion of Bitcoin. This dramatic shift underscores a growing belief that the era of Fed hawkishness may be less impactful than anticipated. Notably, nearly $1 billion worth of Bitcoin was purchased around the $100,000 price level, suggesting that profit-taking and price sensitivity at this psychological threshold may pose less of a constraint than previously assumed.
Three strong BTC ETF buying days after the CPI data.

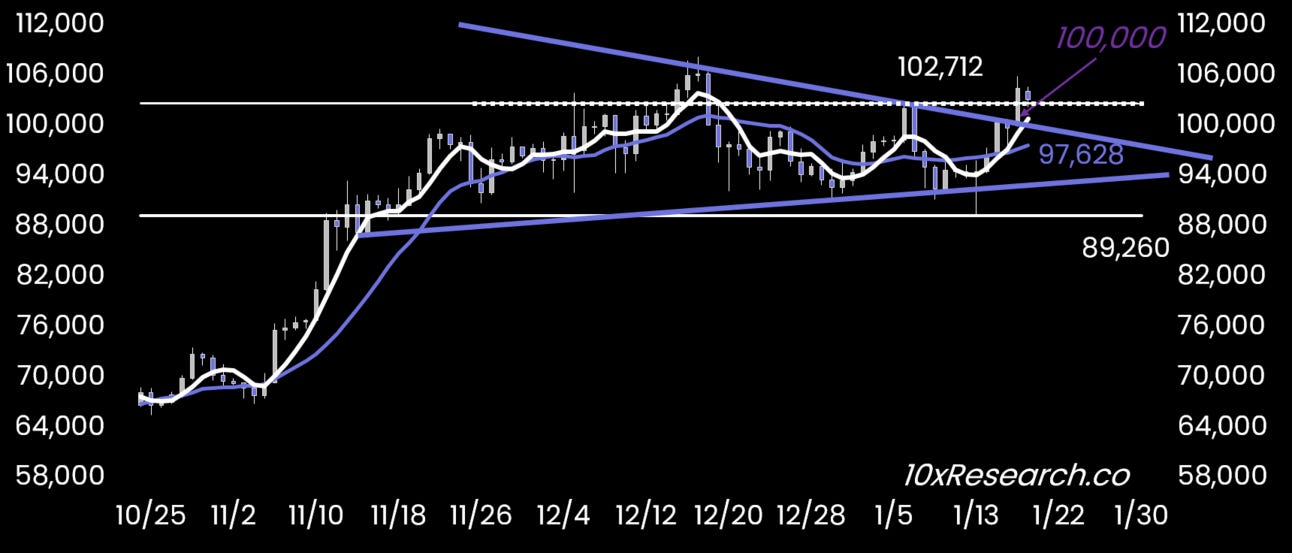
👇6-15) The market structure and flows aligned with a more cautious narrative, where a technical break below the $91,000 level could have triggered significant liquidations. However, the dynamics shifted as this level held on a closing basis, and expectations for higher inflation numbers increased, making the beat of those expectations more likely. Our key technical indicator was the narrowing wedge pattern, where we advised following the breakout direction.
👇7-15) The breakout occurred as Bitcoin surged above $100,000 (marked by the declining purple trendline, the upper level of the wedge) and closed above the early January high of $102,712 (dotted white line). Statistically, this latest closing price represents a shorter-term high, historically leading to higher Bitcoin prices three months later in 7 out of the last 10 similar instances.
Bitcoin wedge is broken; now the purple line becomes support.