FOMO: Spot the next 10x potential altcoin(s) 💥
Helping EVERYONE to make better crypto investment decisions.
🚩 In 10 bullet points.
👇 1) Some of the more recession prone segments of the crypto market are gaming and Web3, where users have been spending more time online and where in-game spending has remained relatively robust. South Korea is a leading market in those segments, as well as in Esports. After a weak Q4 2022, crypto trading volumes have remained stable and are back to Q1 and Q2 2022 levels — according to data from Upbit, South Korea’s largest crypto exchange with an estimated market share of 82% (24 hour trading volume: Upbit $1,965m, Bithumb $315m, Coinone $103m).
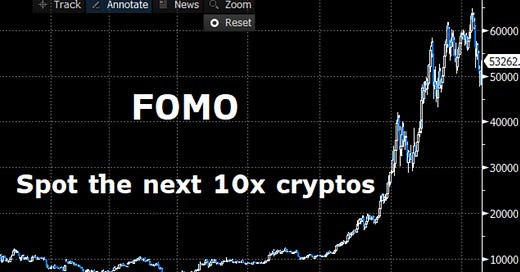
Exhibit 1: Fomo Spot the next 10x cryptos
Step 1: monitor if trading volumes are rising in Korea (as in Jan/Feb 2023).
👇 2) The cryptocurrency market in Korea is predominantly influenced by retail traders. Exchanges like Upbit also appear to have less strategic flows from Bitcoin miners, and see more flows from projects that want to get in front of retail investors. When Aptos launched, the whitepaper was not only available in English but also in Korean, and when Aptos went on a heavy marketing campaign, Korea was the first stop. In terms of volume from the Korean exchange Upbit, we notice that Ethereum is hardly a top 10 trading coin.
👇 3) This is in stark contrast to other crypto exchanges where Bitcoin and Ethereum account for the majority of the volume. While crypto trading in South Korea is the fourth largest market in terms of volume, the dominance of altcoins make South Korea a very interesting market to analyse.
👇 4) A quick snapshot of the trading volume of the last 24 hours (on Coingecko for example) shows that the Bitcoin/KRW cross traded $285m and accounted for 14% of all the volume on Upbit. The rest are all smaller coins that could offer outsized upside opportunities if traders are able to spot trends early.
Step 2: monitor trading volumes, especially among the top 10 traded coins
👇 5) We monitor the daily trading activity and notice that every day, a different token is capturing the top spot for market share, which usually accounts for 14-20% of the day’s trading activity.
👇 6) Because of the reflexive nature of crypto markets, the assumption is that elevated trading activity can attract more traders and lift token prices higher. As a result, the underlying protocol could benefit disproportionately.
Step 3: keep a list of the most actively traded coins, campaigns tend to last for days
👇 7) The website ‘Cryptocurrency Altering’ can be used to monitor new listings as there is a clear historical record of tokens starting to rally a few days before the actual listing, while exchanges and projects tend to deploy marketing strategies once a token is listed. New listings also tend to occur frequently around conferences, hackathons or other events.
Step 4: monitor new listings
👇 8) While we are using our screens and data science for the previous steps, we need to better understand the motivations behind new listings, the teams AND the venture capital firms (if any) that are behind the new listings, etc. Each project and each team is different but this step can differentiate the one day wonders from the 10x movers.
Step 5: find high valuation / low circulation ratio
👇 9) The last step is the most crucial one — do not hold altcoins that trade below their 20-day moving average. This is the time when to get out as those altcoins have a tendency to fall a lot lower than a disciplined trader would hold onto them.
Step 6: use the 20-day moving average for risk management (cut longs below)
👇 10) Each of the last 7 trading days, a different coin accounted for the highest volume: BTC, MVL, SRM, POLYX, IQ, HIFI and ARB. It is crucial that volume is sustained, otherwise with declining volume, prices will most likely collapse too.


