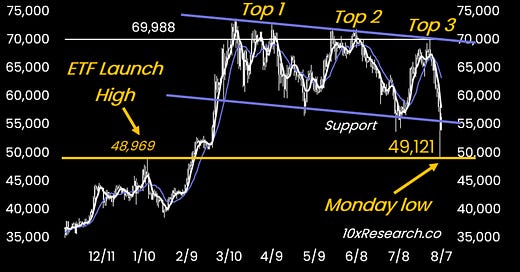
👇1-14) The Bitcoin crash on Monday reversed upon reaching the Bitcoin Spot ETF launch date on January 11/12, 2024, a key reference point in the market's recent history. Traders are focused on the technical aspects of price movements, and a thorough understanding of this analysis can lead to more informed trading decisions. Even the most optimistic crypto traders must acknowledge that the declines have been progressively deeper: 56,500 in May, 53,500 in July, and 49,100 in August.
Bitcoin - a lot of chart technical damage has been done.
👇2-14) Bitcoin is attempting to recover, but the strong resistance from the well-defined downtrend will likely be more challenging after the recent support break. Our bearish outlook stems from monthly technical indicators, which, as of May 2024, have reached levels where prices have historically reversed in previous bull markets, such as in January 2018 and April 2021. We can only confirm this in a few months with the benefit of hindsight. However, it has periodically influenced our expectations of price declines in April, June, and August 2024.
👇3-14) From a technical perspective, the 56,000/57,000 area is expected to act as significant resistance for Bitcoin. A close above this level would be a positive sign. However, it is crucial to have firm stops in place for long positions (54,000) due to the prevailing downside risk indicated by incomplete technical indicators.


